State Housing Report Cards Miss Rural Affordability Crisis
While states receive grades on housing policy, HavenScore data reveals extreme affordability challenges in rural areas that state-level metrics often miss.

State Housing Report Cards Miss Rural Affordability Crisis
Realtor.com Research released updated state report cards for 2026, grading states on housing affordability and homebuilding efforts. The report assigns letter grades based on how well states address current housing needs and future supply challenges.
While state-level assessments provide useful policy frameworks, they can obscure localized affordability crises that demand attention. HavenScore data reveals that some of the most price-burdened communities in America exist in places that might not register on statewide housing dashboards.
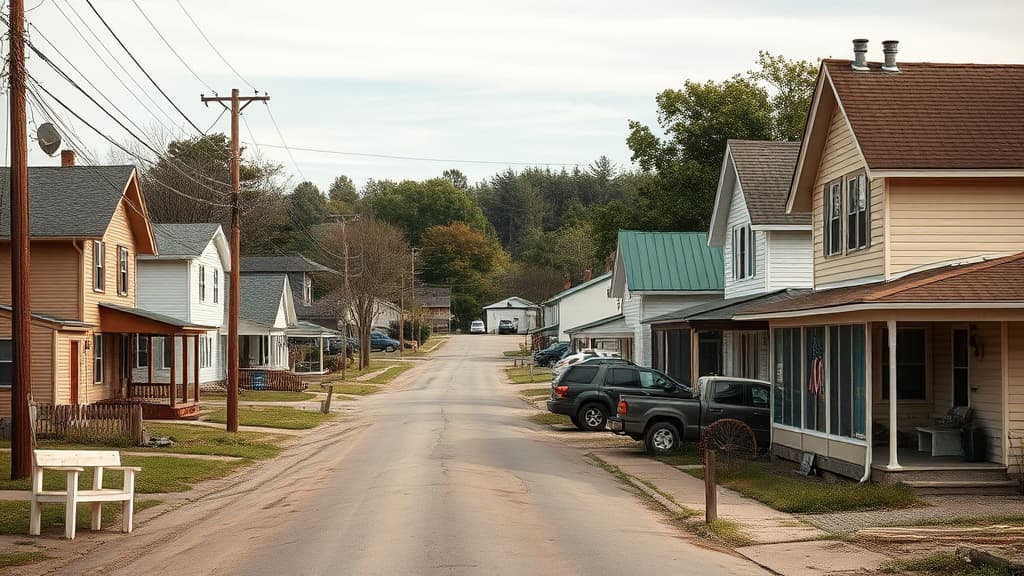
The Limits of State-Level Housing Metrics
State housing report cards typically aggregate data across entire states, which can mask significant variation within state boundaries. A state might receive a passing grade on affordability while containing pockets of severe housing burden that escape notice in broad statistical averages.
The Realtor.com Research report evaluates states on metrics including median home prices relative to income, housing supply growth, and policy initiatives. These measures capture important trends but may not reflect the experiences of residents in smaller communities where housing markets operate differently than in major metropolitan areas.
State policymakers often focus resources on urban areas where housing challenges affect larger populations and generate more political attention. Rural and small-town housing markets, despite serving fewer people, can face equally severe or more extreme affordability pressures.
Insights from HavenScore Data
HavenScore analysis of the most price-burdened ZIP codes reveals affordability challenges that extend far beyond expensive coastal markets. Across the most price-burdened ZIPs in the HavenScore dataset, the price-to-income ratio averages 126.8 – meaning typical home prices are nearly 127 times higher than typical household incomes.
Some individual ZIP codes show even more extreme ratios. ZIP code 67232 in Kansas records a price-to-income ratio of 181.7, while 76429 in Breckenridge, Texas shows 173.6. These ratios indicate that homes cost roughly 170-180 times what typical households in these areas earn annually.
For context, housing is generally considered affordable when prices run 3-5 times annual household income. The Federal Housing Administration typically requires borrowers to keep housing costs below 31% of gross monthly income. At a 180-to-1 price-to-income ratio, housing costs would consume virtually all household income.
Not all severely burdened areas show such extreme ratios. ZIP code 69148 in Lisco, Nebraska records a ratio of 121.9, while 37376 in Sherwood, Tennessee shows 78.8, and 25922 in Princeton, West Virginia shows 78.2. Even these "lower" ratios represent housing costs far beyond conventional affordability thresholds.
Geographic Distribution of Housing Burden
The ZIP codes with the highest price-to-income ratios span multiple states and regions. Kansas, Texas, Nebraska, Tennessee, and West Virginia all contain areas where housing costs create severe burden relative to local incomes.
This geographic spread suggests that extreme housing unaffordability is not limited to high-cost coastal states typically featured in housing affordability discussions. Rural and small-town markets across the interior United States face their own distinct affordability challenges.
These markets often lack the economic diversity and job growth that might support higher housing costs. When home prices rise faster than local wages – whether due to outside investment, limited supply, or other factors – residents face displacement pressure similar to what occurs in expensive urban markets.
Policy Implications for State Housing Strategies
State housing policies designed around metropolitan area conditions may not address the specific challenges facing rural communities. Urban-focused strategies like transit-oriented development, inclusionary zoning, or high-density housing incentives have limited relevance in small towns and rural areas.
Rural housing markets often struggle with different supply constraints than urban areas. Limited construction capacity, higher per-unit infrastructure costs, and smaller market sizes can make new housing development economically challenging even when demand exists.
State policymakers developing housing strategies might consider separate approaches for rural and urban markets. Rural-focused policies could address construction workforce development, infrastructure financing, and regulatory frameworks appropriate for smaller-scale development.
Measurement Challenges in Housing Policy
The disconnect between state-level housing grades and ZIP-level affordability data illustrates broader challenges in housing policy measurement. Aggregate statistics can suggest progress while individual communities experience worsening conditions.
Effective housing policy requires understanding both broad trends and local variations. States earning high grades on housing report cards might still contain communities facing severe affordability crises that demand targeted intervention.
Policymakers and researchers developing housing assessments might consider incorporating measures that capture variation within states, not just statewide averages. This approach could help identify communities most in need of housing assistance and ensure that policy responses address the full spectrum of housing challenges.
Data Limitations and Future Research
HavenScore price-to-income ratios reflect specific methodological choices about income measurement and price calculation. Different approaches to measuring affordability might yield different results, and extreme ratios in some ZIP codes might reflect data limitations rather than actual market conditions.
Future research could examine the factors driving high price-to-income ratios in rural areas, including local economic conditions, housing supply constraints, and demographic changes. Understanding these drivers could inform more targeted policy responses.
The relationship between state-level housing policies and local affordability outcomes also deserves further study. Some states might achieve good overall grades while struggling to address localized housing challenges that require different policy approaches.
affordability
Housing Affordability Crisis Hits Rural Areas Hardest
While housing debates focus on major metros, HavenScore data shows the most severe affordability crises are concentrated in small rural communities across Kansas, Texas, and Nebraska.

affordability
Boston Business Growth Highlights National Housing Affordability Gap
Boston's international business growth creates housing demand in an already expensive market, while HavenScore data reveals rural areas face even more severe affordability challenges.

affordability
High Price Burdens Keep Homeowners From Tapping Record Equity
Despite record home equity, homeowners are avoiding HELOCs due to high rates and stretched budgets. HavenScore data shows price-to-income ratios above 120 in the most burdened markets.
Every claim is pegged to our ZIP-level data.
See Havenscores, affordability, and forecasts for every U.S. ZIP — free.